
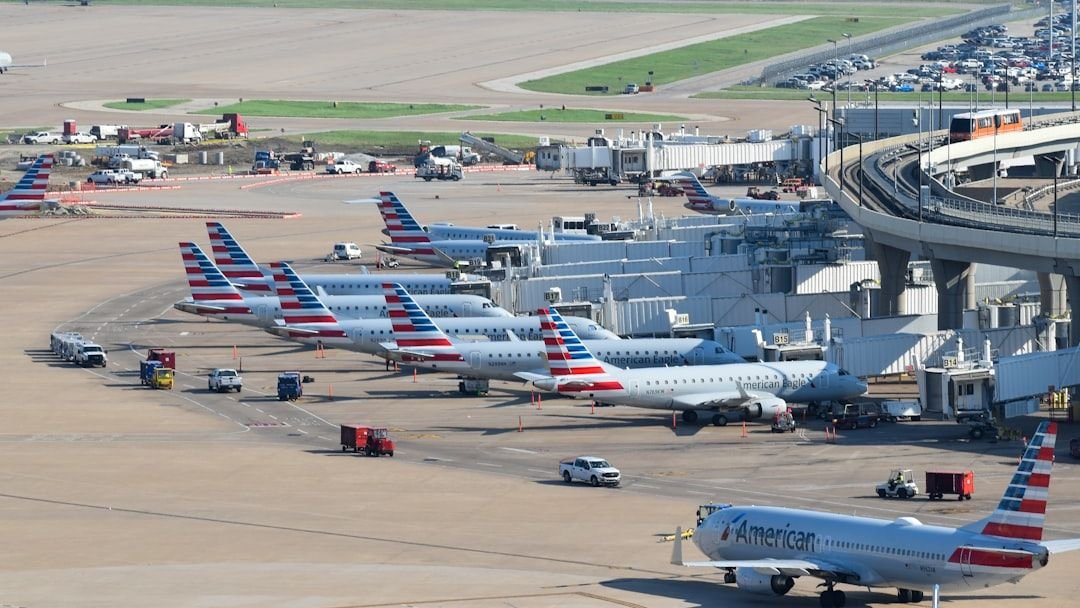
Most people assume a bad airport experience is just bad luck – a freak storm, an understaffed gate, a one-time meltdown. Frequent flyers know better. There are certain airports where the chaos isn’t occasional. It’s the operating model. In 2024, U.S. airlines racked up 437 domestic tarmac delays exceeding three hours – the most in a single year since the Tarmac Delay Rule took effect in 2010, up sharply from 289 the year before. The people absorbing the worst of it aren’t casual vacationers. They’re road warriors who know every shortcut, every lounge, every workaround – and they’re still getting burned.
The airports on this list aren’t just busy. They have documented, repeat-offender problems: the worst delay rates in the country, TSA complaint records, legendary baggage failures, and incidents that made national news. A few of them will surprise you. One of them might be your home airport – and if it is, you already know exactly why it made the list.
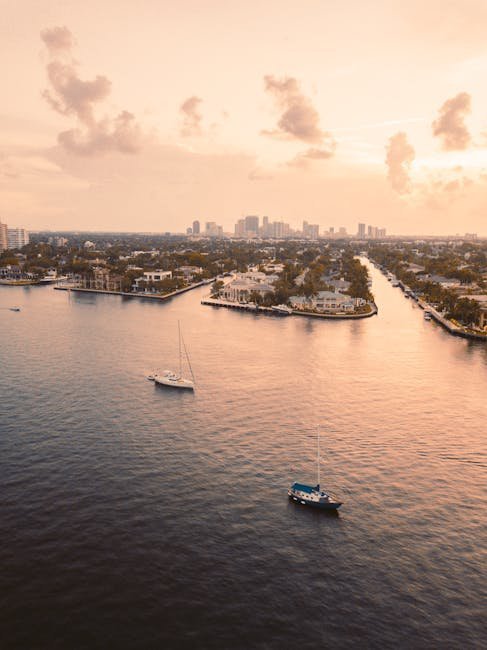
#13 – Seattle-Tacoma International Airport (SEA): The Fog and Gate Trap
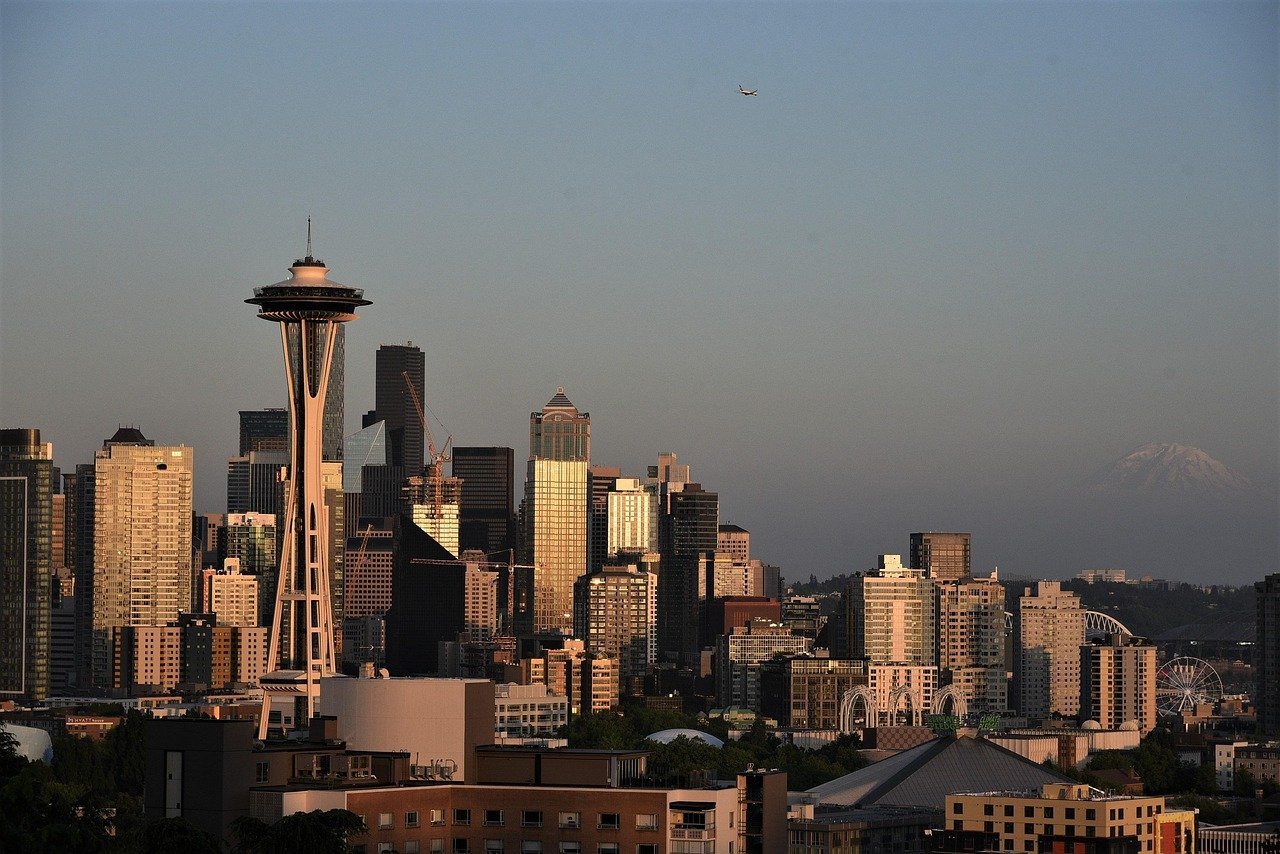
Sea-Tac looks great on paper. It’s modern, it connects the Pacific Northwest to the world, and the food isn’t bad. But frequent flyers have grown deeply tired of what happens when the weather turns – which, in the Pacific Northwest, is a lot. The airport sits in a valley that collects fog, and when that combines with a genuine gate shortage during peak travel periods, the result is a cascade of delays that experienced travelers have come to treat as a near-certainty.
Seattle-Tacoma saw 23.3% of its flights disrupted in a 2024 analysis of major U.S. hubs – roughly one in four travelers passing through SEA dealing with some form of pain. The gate shortage is the part that doesn’t get enough attention: it isn’t just a weather problem, it’s a capacity problem that weather makes catastrophic. Seasoned flyers have quietly started treating any Sea-Tac connection under two hours as a gamble they’d rather not take.
Fast Facts
- Sea-Tac sits in a natural valley that traps fog – a structural geographic disadvantage that no renovation can fix
- 23.3% flight disruption rate recorded at SEA in a 2024 major-hub analysis
- Gate shortages turn routine weather delays into full-blown cascades during peak travel windows
- Frequent flyers widely recommend a minimum 2-hour buffer for any SEA connection
#12 – Houston George Bush Intercontinental Airport (IAH): Texas-Sized Disruptions
Houston’s main international gateway sounds impressive until you look at the numbers. George Bush Intercontinental Airport posted a 40.6% flight disruption rate in 2024 – one of the worst among major American airports, and a figure that should alarm anyone with a tight connection or an important meeting waiting on the other end. That’s nearly half of all flights experiencing some form of problem, and it’s been consistent enough that frequent flyers have stopped being surprised by it.
IAH is a massive, multi-terminal complex that can feel genuinely punishing to navigate. The distances between terminals are long, the signage has frustrated travelers for years, and the airport’s exposure to Gulf Coast weather – hurricanes, severe thunderstorms, flash flooding – creates a seasonal gauntlet that shows up in the data every single year. Experienced travelers routing through Houston have increasingly built in buffer time they shouldn’t have to build in, or they’ve started booking around it entirely.
#11 – Los Angeles International Airport (LAX): The Gridlock That Never Ends
LAX has been promising to fix itself for decades. There have been real investments – a new automated people mover, renovated terminals, a long-awaited rail connection to the city. But for the more than 38 million departing passengers who moved through it in 2024, the core experience remains deeply aggravating. Los Angeles is famous for traffic, and that reputation extends fully into the airport – sometimes the crawl along LAX’s loop road takes longer than the flight itself.
LAX is the primary gateway between the U.S. and the Asia-Pacific region, and with four parallel runways and a massive customs facility at the Tom Bradley International Terminal, the airport does its best to absorb that demand. It consistently falls short. Common delay drivers include weather and ground congestion, and for international arrivals, the customs hall remains one of the slowest in the country – a brutal ending to an already exhausting long-haul flight.
#10 – Fort Lauderdale-Hollywood International Airport (FLL): Florida’s Overcrowded Shortcut
Fort Lauderdale was supposed to be the smarter alternative to Miami – less crowded, easier to navigate, better value. That reputation is now largely a myth. FLL posted a 30.5% flight disruption rate in 2024, putting it squarely in the company of airports twice its size. Budget carriers flooded the airport with routes, and the infrastructure never kept pace with the passenger volume those airlines brought with them.
Fort Lauderdale-Hollywood recorded 5.5 security-related delays per 1,000 delayed flights, with an average TSA-related hold-up of 31.9 minutes – placing it among the worst in the country for security lines. The terminals feel undersized for the crowds they’re absorbing, seating near gates is perpetually scarce, and the ground transportation situation draws consistent complaints. Travelers who chose FLL specifically to dodge Miami’s chaos are now living inside their own version of it.
Quick Compare
- FLL vs. MIA security wait: FLL averages 31.9 min TSA hold-up vs. MIA’s chronic top-5 ranking for worst wait times nationally
- FLL disruption rate: 30.5% – higher than many airports three times its size
- The promise vs. reality: Marketed as the “easy” South Florida option; now mirrors the congestion it was supposed to replace
- Root cause: Budget carrier route explosion with zero matching infrastructure investment
The Road Warrior's Reality Check: U.S. Airport Nightmares
Think your last flight delay was just bad luck? For frequent flyers, certain hubs are notorious for systemic chaos. Test your knowledge of the data and disasters behind America's most frustrating airports.
Think you caught the key details? Take the quick quiz and see how sharp your instincts really are.
#9 – Denver International Airport (DEN): Weather Roulette at 5,430 Feet

Denver International dazzles first-timers and exhausts everyone else. The tent-roofed main terminal is architecturally striking, the art is famously strange, and the concourses are genuinely well-appointed. But none of that matters when you’re watching your connecting flight disappear from the board while a blizzard settles over the Front Range. Denver logged a 28.7% flight disruption rate in 2024 – one of the higher figures among major hubs.
The airport’s elevation and weather exposure make it uniquely vulnerable to cascading delays. A single afternoon thunderstorm in July or a plains snowstorm in February can paralyze the entire hub for hours – and because Denver is a major connecting point for both United and Frontier, those delays ripple outward across the whole country. Frequent flyers who love Denver as a destination have learned to treat DEN as a connector with genuine risk attached, especially from November through March and again during summer storm season.
#8 – Charlotte Douglas International Airport (CLT): The American Airlines Hub That Can’t Catch a Break
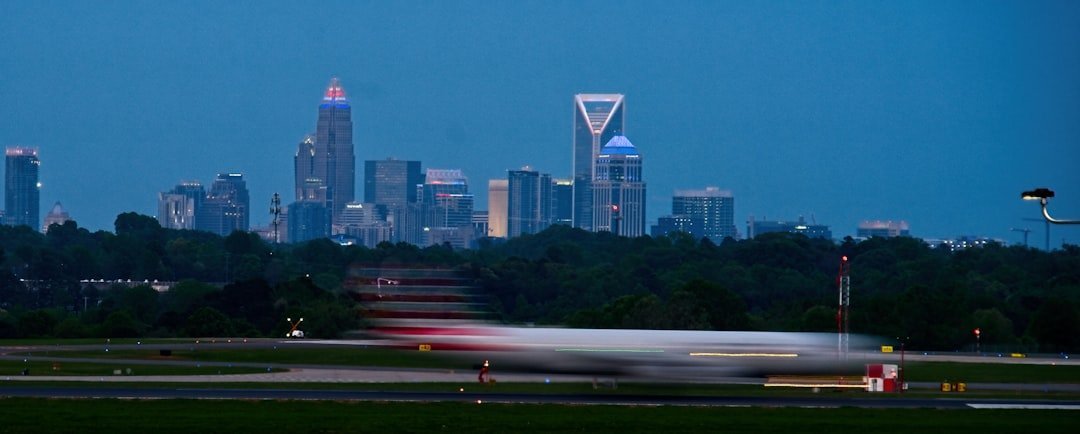
Charlotte Douglas is one of the most critical hubs in American Airlines’ network, which means tens of millions of passengers flow through it every year whether they want to or not. The problem is that CLT has developed a real reputation for cancellations that goes well beyond weather excuses.
Between July 2024 and June 2025, CLT posted a 24.6% delay rate with an average delay of 73.9 minutes. The airport sits squarely in Tornado Alley’s eastern extension, making spring and summer especially punishing. Travelers who rely on CLT for connections have learned the hard way that American’s hub-and-spoke density means when things go wrong here, they go very wrong, very fast – and the rebooking lines stretch for what feels like the length of a runway.
#7 – Miami International Airport (MIA): Inefficiency as a Feature
Miami International has a talent for finding new ways to waste your time. It isn’t always the single worst airport in any one category, but it turns up near the top of nearly every bad list – and that consistency is its own damning story. MIA ranks among the worst for TSA wait times, early-morning flight delays, runway taxiing times, and holiday-season chaos. A large volume of routes to Latin America and the Caribbean means operational challenges and seasonal weather pile on top of one another almost year-round.
MIA’s layout is notoriously disjointed, turning even a simple connection into a navigational stress test. A 2024 analysis found 31.7% of flights disrupted at Miami – and the airport consistently scores near the bottom on passenger experience. Seasoned flyers connecting through MIA to South America or the Caribbean have developed a singular strategy: give yourself at least two hours of connection time, and accept that it probably still won’t feel like enough.
Worth Knowing
- MIA’s layout spans multiple concourses with long inter-terminal walks – a simple domestic connection can feel like a half-mile sprint
- 31.7% flight disruption rate in 2024; consistently near the bottom of passenger experience rankings
- Routes to Latin America and the Caribbean create near-year-round weather exposure layered on top of operational strain
- MIA routinely appears on worst lists for TSA wait times, taxiing delays, and holiday-season chaos simultaneously
- Experienced travelers recommend a minimum 2-hour connection and still call it optimistic
#6 – Dallas/Fort Worth International Airport (DFW): The Delay Capital of Texas
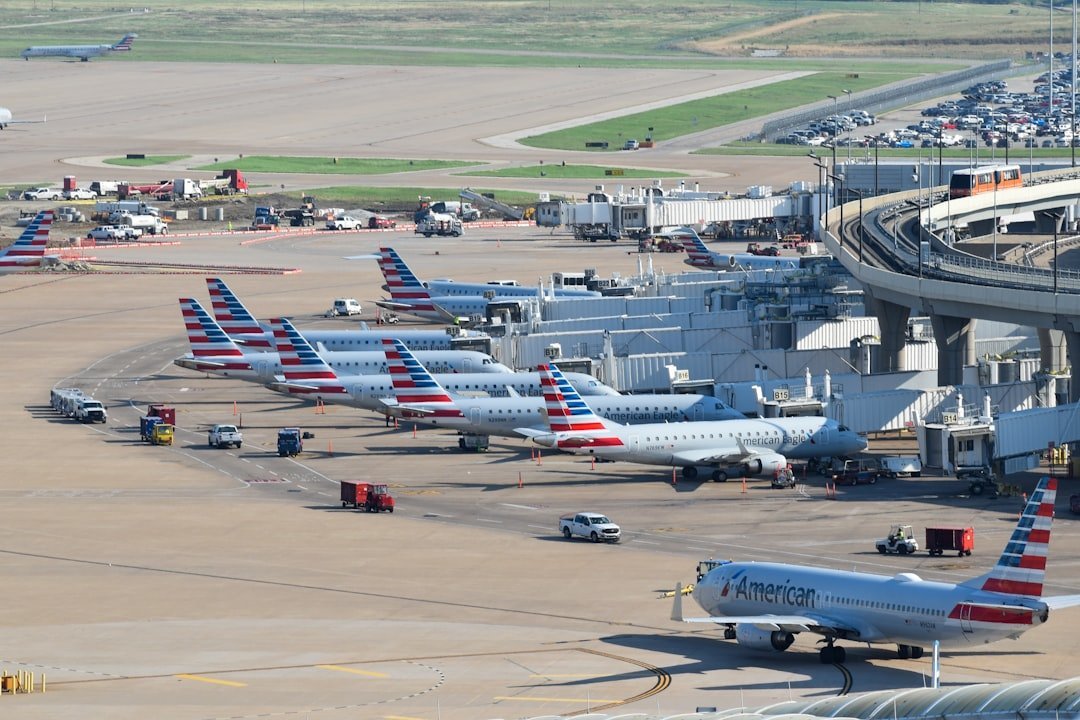
DFW is one of the largest airports in the world by land area, and it sometimes feels like every one of those acres was designed to slow you down. Dallas/Fort Worth topped one major disruption ranking with 45.6% of flights disrupted in May 2024 – nearly half of all flights experiencing some form of problem. That figure is extraordinary for a major hub, and it reflects both the airport’s Texas weather exposure and the sheer volume of traffic it’s attempting to process every single day.
Between July 2024 and June 2025, DFW posted a 26.1% delay rate with an average delay of 71.6 minutes. Dallas/Fort Worth was one of only three airports to appear on both the most-delayed and most-canceled lists in 2024 – a distinction shared with Orlando and Tampa. For American Airlines, which uses DFW as its primary hub, every major weather event becomes a domino effect that strands passengers across the country. Frequent flyers have taken to half-jokingly calling a DFW connection “the tax you pay for living in the middle of America.”
#5 – Orlando International Airport (MCO): Lost Bags, Lost Patience

Orlando sells itself on magic and family fun, but the airport experience is anything but. MCO has built a remarkable record of failure across multiple categories simultaneously – which takes a certain kind of dedication to get consistently wrong. MCO leads the U.S. in lost and damaged luggage, with a mishandling rate 63% higher than the national average, and it has accumulated the third-most complaints against the TSA of any airport in the country, with poor customer service driving the majority of those grievances.
Long security lines, delayed holiday flights, overcrowded terminals, and scarce seating all contribute to an atmosphere of grinding chaos – which is why MCO topped MarketWatch’s 2024 customer survey for worst airport layovers. Availability of seating, cleanliness, access to charging stations, and food-and-beverage service all received abysmal ratings. If your bag actually makes it to baggage claim intact at MCO, experienced travelers have started treating that as a minor victory worth acknowledging.
#4 – Philadelphia International Airport (PHL): Grit Without the Glory
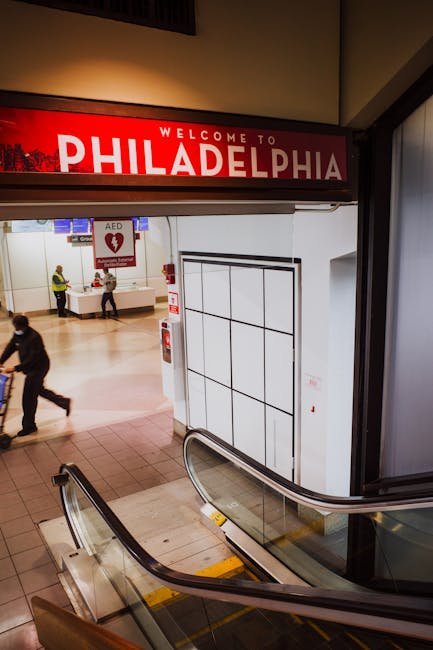
Philadelphia’s airport has long carried the reputation of being one of the most frustrating hubs on the East Coast, and the data consistently backs that up. A 2024 analysis using TSA complaint data placed Newark first, JFK second, and Philadelphia third for passenger complaints per 100,000 travelers – a trend that has held across multiple years. PHL isn’t an outlier having a bad run. It’s a repeat offender.
The airport compounds its delay problems with chaotic baggage claim, documented security camera gaps in parking garages that have contributed to chronic car thefts, and TSA lines that have left travelers waiting for hours during peak travel periods. Officials have announced plans to install new seating and carpets near departure gates ahead of 2026 – which tells you something meaningful about how far behind PHL is starting from and how long it’s been that way.
#3 – Baltimore/Washington International Airport (BWI): The Delay Record-Holder

BWI bills itself as the convenient, no-nonsense alternative to the D.C. area’s bigger airports. On a good day, it can be exactly that. The problem is that good days are genuinely rare. One analysis identified Baltimore/Washington International as having among the worst flight delay rates of any major U.S. airport – with roughly 29% of flights leaving at least 15 minutes late based on a year of federal transportation data, and a summer delay rate of 38.9%, far above the national average of 26.4%. No other mid-Atlantic hub comes close to that combination.
BWI saw 27 million passengers in 2024, and in early March 2025 a massive power outage delayed, diverted, or outright canceled journeys for thousands of travelers in a single event. July sees the longest average delays at the airport – over 62 minutes per delayed flight – and the evening hours are consistently the most punishing, with nearly 1 in 4 evening departures running late. Frequent flyers who use BWI to save money on Southwest fares are essentially making a calculated trade: cheaper tickets in exchange for a genuinely higher probability of sitting on the tarmac wondering where it all went wrong.
At a Glance
- ~29% of flights depart at least 15 minutes late based on a year of federal data – among the worst rates at any major U.S. hub
- Summer delay rate: 38.9% vs. a national average of just 26.4%
- July average delay: 62+ minutes per delayed flight
- Evening flights (5–9 p.m.) delayed nearly 24% of the time – the riskiest window to book
- Southwest dominates BWI traffic; late arrivals ripple through the carrier’s entire schedule
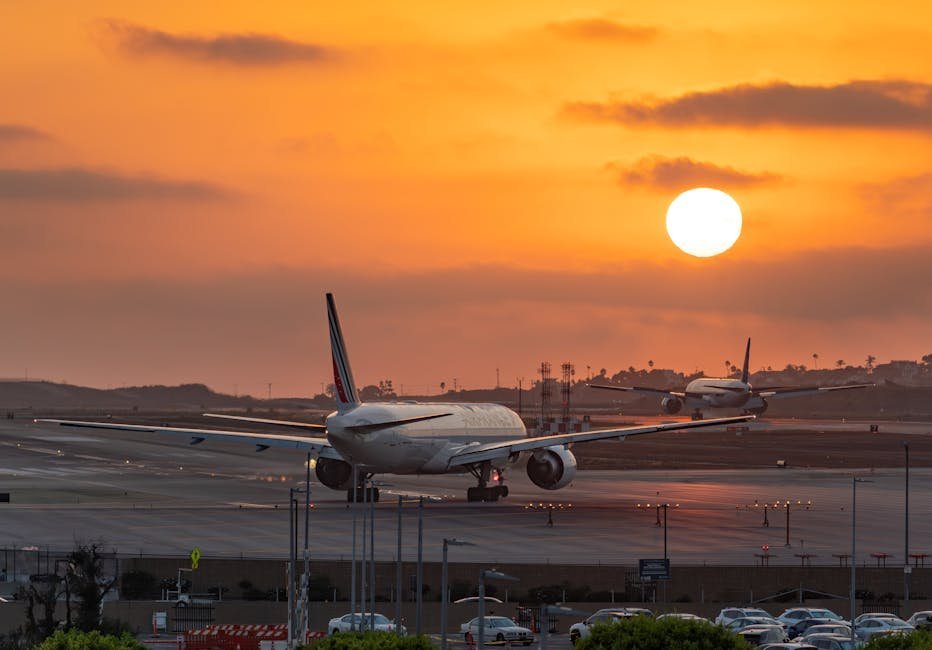
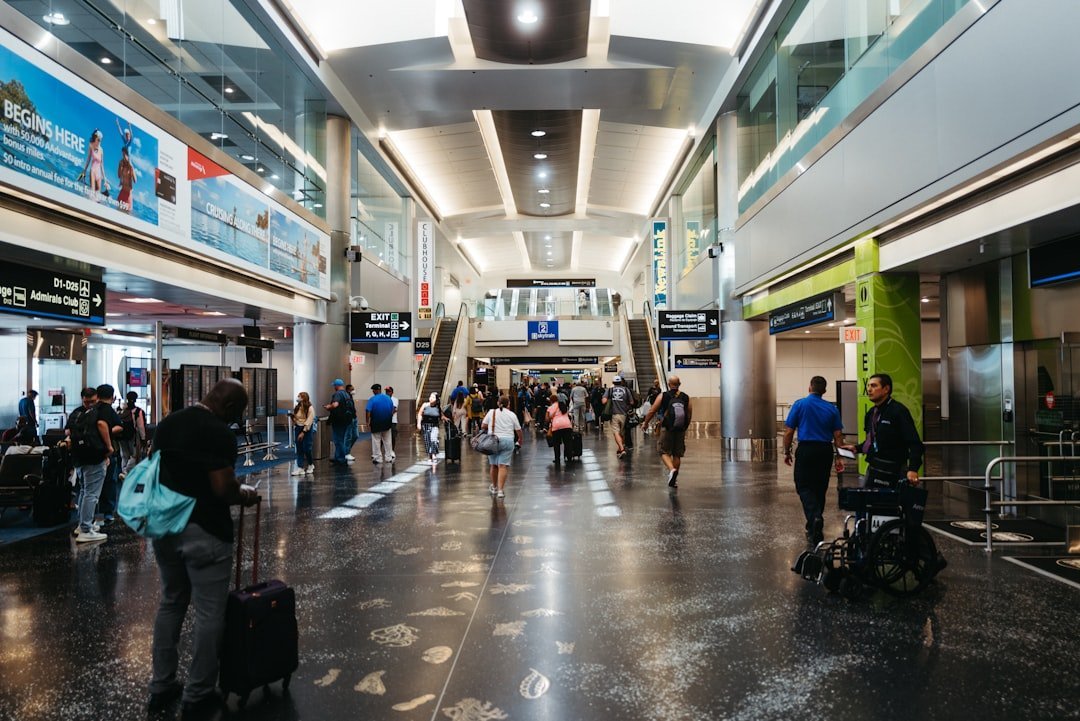
#2 – John F. Kennedy International Airport (JFK): The $19 Billion Problem

JFK has a complicated relationship with its own reputation. In early 2025, it was named the most luxurious airport in the United States – 11th in the world – based on the number of lounges, luxury brand retailers, and the onsite availability of champagne and caviar. That sounds appealing until you actually try to catch a connecting flight. Nearly half of JFK’s flights departed late in 2024, and the airport consistently ranks near the top of studies tracking the longest security lines, worst passport control waits, most mishandled baggage, and highest delay rates. Pilots have cited it as one of the airports they quietly dread flying into.
A massive $19 billion construction and renovation project is underway – the largest in JFK’s history – with new Terminal 1 opening its first 14 gates in mid-2026 and full completion of that terminal not scheduled until 2030. That means years of snarled road access, construction-zone confusion inside and outside the terminals, and a passenger experience that hasn’t caught up to the prices people are paying to use it. JFK is simultaneously one of America’s most glamorous airports and one of its most operationally exasperating. That gap is the whole problem.
The Road Warrior's Reality Check: U.S. Airport Nightmares
Think your last flight delay was just bad luck? For frequent flyers, certain hubs are notorious for systemic chaos. Test your knowledge of the data and disasters behind America's most frustrating airports.
Think you caught the key details? Take the quick quiz and see how sharp your instincts really are.
#1 – Newark Liberty International Airport (EWR): America’s Most Chaotic Airport

No airport in the United States generates more documented misery per passenger than Newark Liberty – and the evidence isn’t hard to find. A major 2024 analysis ranked EWR as the single worst airport in the country for passenger complaints, finishing ahead of JFK and Philadelphia.
On April 28, 2025, controllers at the Philadelphia TRACON facility – which guides aircraft in and out of Newark – lost radar and radio contact with roughly 15 to 20 aircraft simultaneously. The system running on decades-old copper wiring simply failed. Five controllers took trauma leave afterward, deepening an already severe staffing shortage. More than 1,700 cancellations and delays hit EWR in the week that followed, passenger volume fell 20% in May compared to the prior year, and the FAA ultimately imposed limits on arrivals and departures through the end of 2025. Frequent flyers with elite status, lounge access, and two decades of travel experience started flat-out refusing EWR connections as a matter of personal policy – and even the Transportation Secretary publicly advised his own family to rebook away from Newark.
Why It Stands Out
- 5 controllers took trauma leave after the outage – worsening an existing staffing crisis at Philadelphia TRACON
- 1,700+ cancellations and delays in the single week following the April 28 incident
- FAA capped arrivals and departures at 28 per hour and extended the limit through late 2026
- ATC infrastructure at the facility dates to 1973; some systems still rely on copper wiring and floppy-disk-era computers
- Transportation Secretary Sean Duffy publicly advised his own family to rebook away from Newark
The frustrating truth behind this list is that most of these airports aren’t failing because of one catastrophic event – they’re failing because the same preventable problems stack up year after year: understaffed security checkpoints, aging infrastructure absorbing record passenger volumes, weather exposure that original planners never accounted for, and construction timelines measured in decades. In 2025, roughly 1 billion passengers departed from U.S. airports, and nearly a quarter of them experienced a delay or cancellation. That’s not bad luck. That’s a system under pressure at specific, identifiable breaking points. The airports on this list are where those breaking points live.